USA
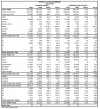
For the first time since November 2019, Lexus USA has reported its monthly sales numbers — 33,186 total sales for March 2021, a 104.7% increase over last year. Here’s the model-by-model breakdown:
| MONTH | Year to Date (*DSR) | |||||
| 2021 | 2010 | % CHG* | 2021 | 2020 | % CHG* | |
| IS | 2,514 | 913 | 164.8 | 6,028 | 2,712 | 128.3 |
| RC | 357 | 169 | 103.1 | 777 | 757 | 5.4 |
| ES | 4,664 | 2,854 | 57.1 | 10,192 | 9,247 | 13.2 |
| GS | 7 | 173 | -96.1 | 52 | 624 | -91.4 |
| LS | 403 | 162 | 139.2 | 1,137 | 801 | 45.8 |
| Total Cars | 8,183 | 4,327 | 81.8 | 18,840 | 14,383 | 34.5 |
| UX | 1,826 | 984 | 78.4 | 3,993 | 3,838 | 6.9 |
| NX | 6,466 | 3,175 | 95.8 | 14,462 | 11,309 | 31.3 |
| RX | 12,950 | 5,534 | 125.0 | 27,941 | 20,847 | 37.7 |
| GX | 3,337 | 1,350 | 137.7 | 7,677 | 5,122 | 53.9 |
| LX | 424 | 215 | 89.6 | 1,340 | 846 | 62.7 |
| Total Trucks | 25,003 | 11,258 | 113.5 | 55,413 | 41,962 | 35.6 |
| Total Sales | 33,186 | 15,585 | 104.7 | 74,253 | 56,345 | 35.3 |
Please note, all percentages are calculated by the Daily Sales Rate (DSR), which takes into account the number of days in the month that dealerships could sell cars. March 2020 had 25 selling days, March 2021 had 26 selling days.
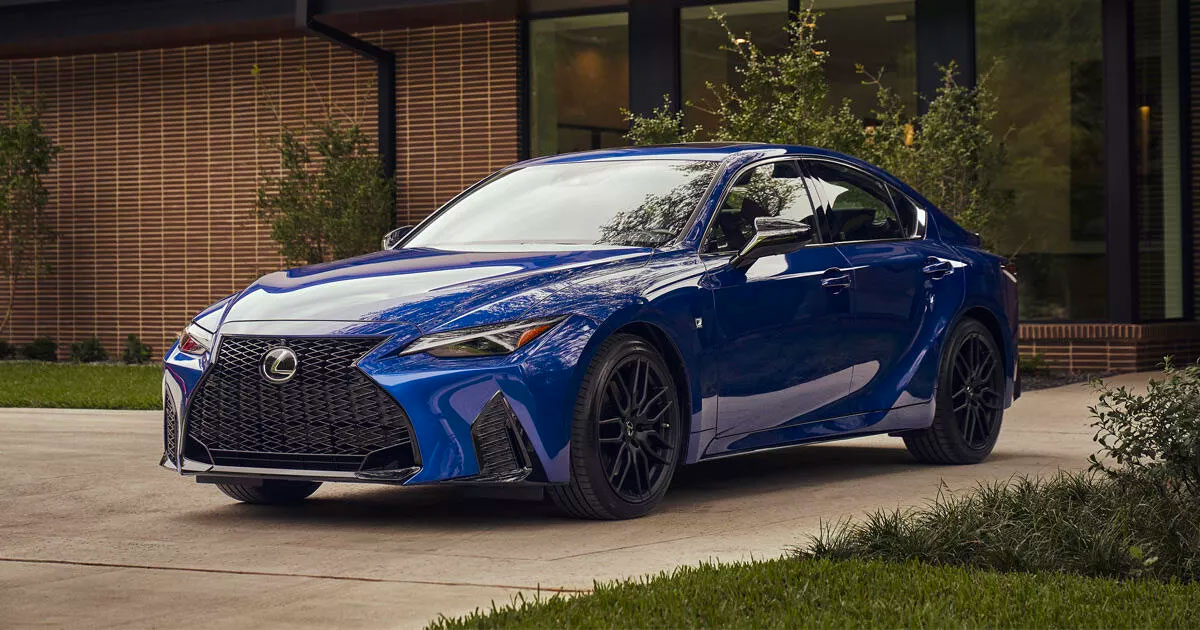
This is the best-ever March for Lexus USA, and caps off a first quarter that’s the second best in the brand’s history. Hybrid sales were up 125.9 percent, lead by the crossover lineup. The IS is booming, almost tripling sales, but the entire car lineup was up 89.1 percent compared to last March.


