USA
Lexus USA has reported 28,902 total sales for July 2017, a 7.8% increase over last year — here’s the model-by-model breakdown:
| MONTH | Year to Date (*DSR) | |||||
| 2017 | 2016 | % CHG* | 2017 | 2016 | % CHG* | |
| CT | 442 | 849 | ‐45.9 | 4,368 | 5,364 | ‐18.1 |
| IS | 2,443 | 3,461 | ‐26.6 | 14,771 | 20,560 | ‐27.8 |
| RC | 522 | 977 | ‐44.4 | 3,621 | 6,269 | ‐41.9 |
| ES | 6,641 | 5,497 | 25.6 | 28,441 | 33,390 | ‐14.3 |
| GS | 652 | 1,218 | ‐44.3 | 4,205 | 8,670 | ‐51.2 |
| LS | 402 | 433 | ‐3.4 | 2,257 | 3,311 | ‐31.4 |
| LC | 313 | 0 | 0 | 1,158 | 0 | 0 |
| LFA | 1 | 0 | 0 | 1 | 6 | ‐83.2 |
| Total Cars | 11,416 | 12,435 | ‐4.5 | 58,822 | 77,570 | ‐23.7 |
| NX | 5,406 | 4,689 | 19.9 | 31,429 | 27,979 | 13 |
| RX | 9,632 | 8,522 | 17.5 | 56,369 | 57,934 | ‐2.2 |
| GX | 2,075 | 1,918 | 12.5 | 12,972 | 13,068 | ‐0.2 |
| LX | 373 | 326 | 19 | 3,070 | 2,903 | 6.4 |
| Total Trucks | 17,486 | 15,455 | 17.7 | 103,840 | 101,884 | 2.5 |
| Total Sales | 28,902 | 27,890 | 7.8 | 162,662 | 179,454 | ‐8.8 |
Please note, all percentages are calculated by the Daily Sales Rate (DSR), which takes into account the number of days in the month that dealerships could sell cars. July 2017 had 25 selling days, July 2016 had 26 selling days.
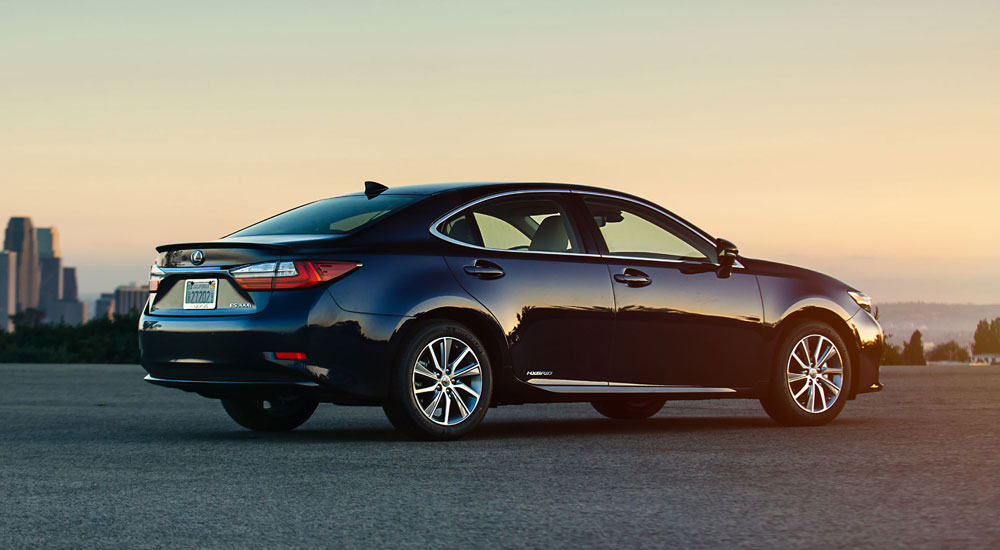
The ongoing Golden Opportunity Sales event has breathed new life into Lexus sales in the USA, with multiple models having their best month in quite some time. It all adds up to the second-best July in the brand’s history. The ES is the lone car to show a sales increase, and its 6,641 units sold is the best month for the mid-size sedan in a decade. The NX also turned in its best-ever July, and the LX and RX both showed significant jumps.
Here’s how Lexus did against the German Three:
- Lexus USA: 28,902 sales
- Mercedes USA: 25,909 sales
- BMW USA: 21,965 sales
- Audi USA: 18,824 sales
Canada
Lexus Canada has reported their 13th consecutive monthly sales record with 2,018 luxury vehicles sold, up 7.2% compared to last year. As expected, the SUVs are playing a big part in the success — RX sales are up 19.4% to 740 sales, and NX sales set a July record with 624 units sold.
| MONTH | Year to Date (*DSR) | |||||
| 2017 | 2016 | % CHG* | 2017 | 2016 | % CHG* | |
| CT | 43 | 44 | -2.3% | 285 | 316 | -9.8% |
| IS | 311 | 265 | 17.4% | 1918 | 1700 | 12.8% |
| RC | 49 | 52 | -5.8% | 288 | 298 | -3.4% |
| ES | 132 | 207 | -36.2% | 1102 | 1225 | -10.0% |
| GS | 16 | 40 | -60.0% | 197 | 250 | -21.2% |
| LS | 2 | 0 | 200% | 35 | 55 | -36.4% |
| LC | 29 | 0 | 0 | 61 | 0 | 0 |
| Total Cars | 582 | 608 | -4.3% | 3886 | 3844 | 1.1% |
| NX | 624 | 510 | 22.4% | 4089 | 3335 | 22.6% |
| RX | 740 | 620 | 19.4% | 5241 | 4429 | 18.3% |
| GX | 39 | 40 | -2.5% | 327 | 315 | 3.8% |
| LX | 33 | 105 | -68.6% | 639 | 399 | 60.2% |
| Total Trucks | 1436 | 1275 | 12.6% | 10296 | 8478 | 21.4% |
| Total Sales | 2018 | 1883 | 7.2% | 14182 | 12322 | 15.1% |


Comments